Arpit Kumar
Arpit Kumar
Hi! I am a 20 year old undergrad pursuing engineering in Computer Science from VIT Bhopal University, I am a data science enthusiast, a web development aficionado and I have a knack for managing things, people and projects.
Why hire me?
No matter what the task at hand is, it has always been my aim to contribute towards the objective, either by being a leader or a team player.
Always thriving to better, complimented with both efficient verbal and non-verbal communication skills aquired over the years by participating in all sorts of activites and competitions assist me to grow in all kinds of workspaces.
Technical depth and understanding of concepts, may it be web development or data analysis along with the ability to leave no page unturned equip me to finish all tasks assigned.
Critical thinking supplemented with efficient problem solving make me the out and out candidate.

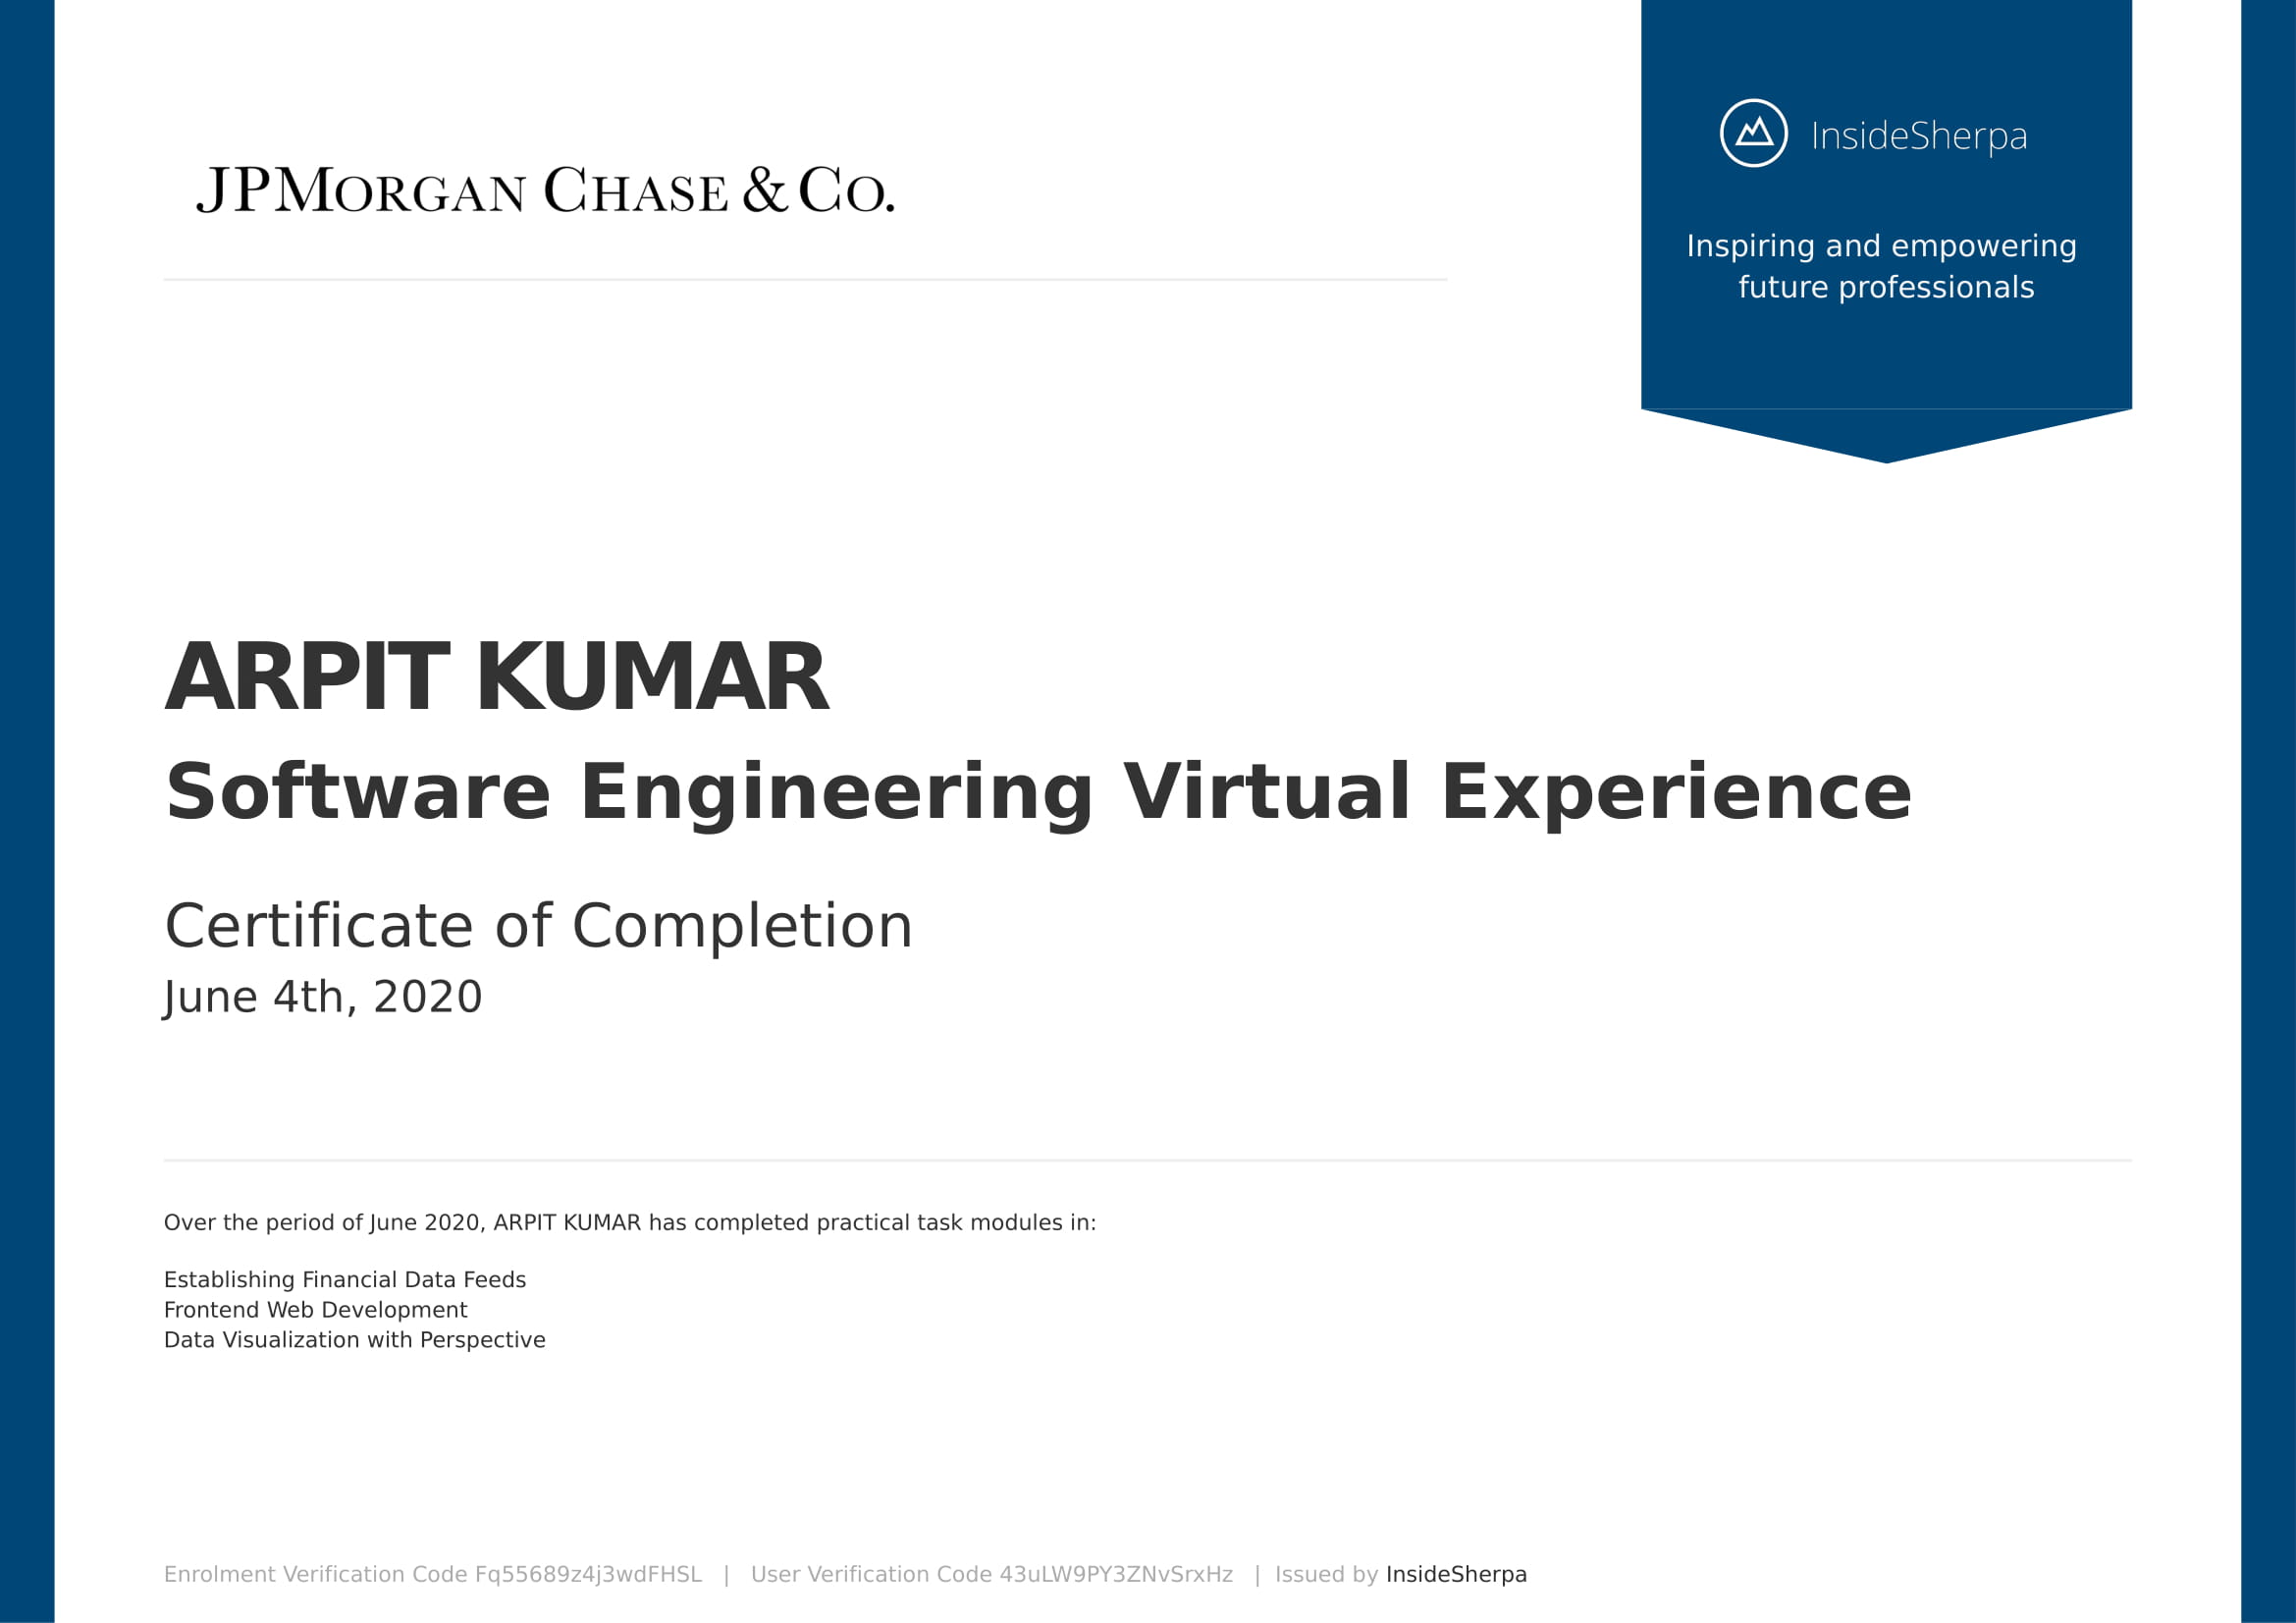
JPMorgan Chase Software Engineering Virtual Experience Internship
June,2020
Assisting with development of an alternative way to visualize and analyze share price data for traders – thus alerting them of potential trading opportunities. Setting up our system so we can interface with the relevant financial data feed, make the required calculations and then present this in a way that allows the traders to visualize and analyze this data in real time.
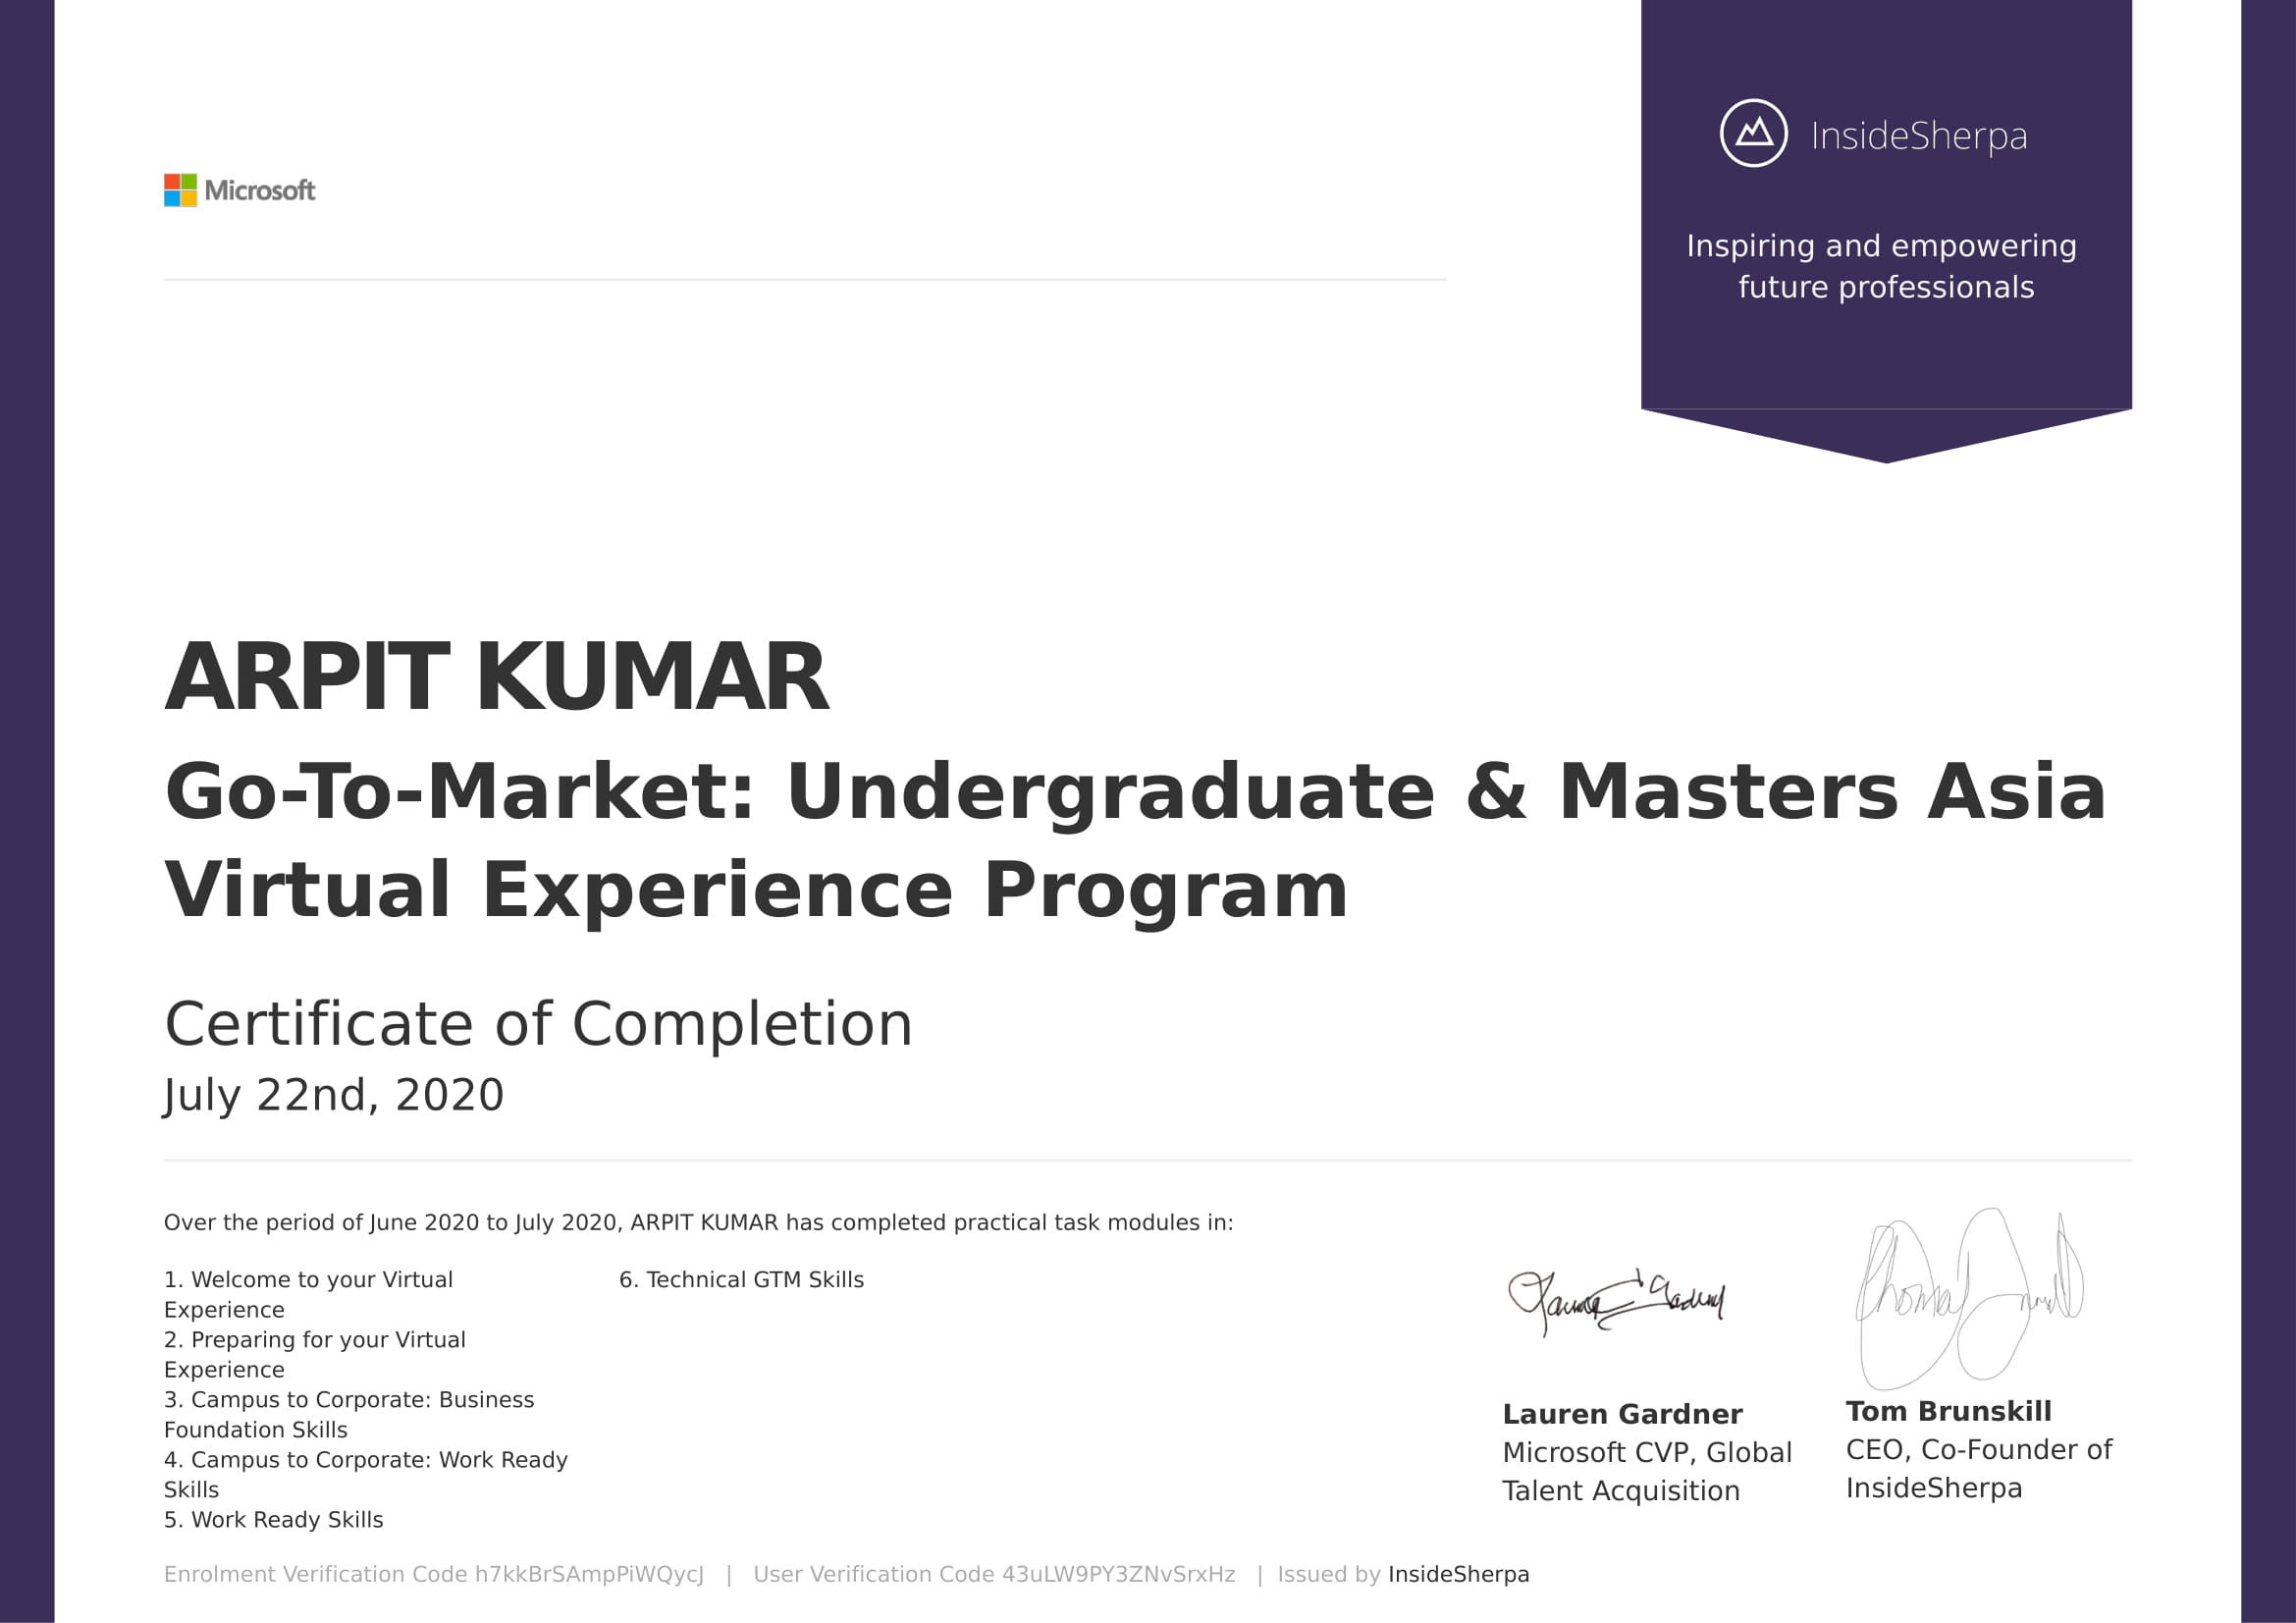
Microsoft Go-To-Market: Undergraduate & Masters Asia Virtual Experience Internship Program
July,2020
Virtaully experiencing asn well as gaining insights of the technicalities and values that go into wokring at Microsoft. Along with gaining business skills while experiencing the transition from campus to corporate through various Microsoft real life activities. Learning Work ready skills from highly rated Microsoft professional and employees.
United Nations India Office Internship, Delhi
July,2019
An in-office volunteer internship where I got to learn about the various programs going on in India undertaken by the UN-HABITAT such as projects on housing and urban affairs, as well as housing in vulnerable cities.An enriching experience in a non-technical field thus helping me to broaden horizons.This internship was done under the guidance of Mr.Hitesh Vaidya, Country Manager UN-HABITAT India.

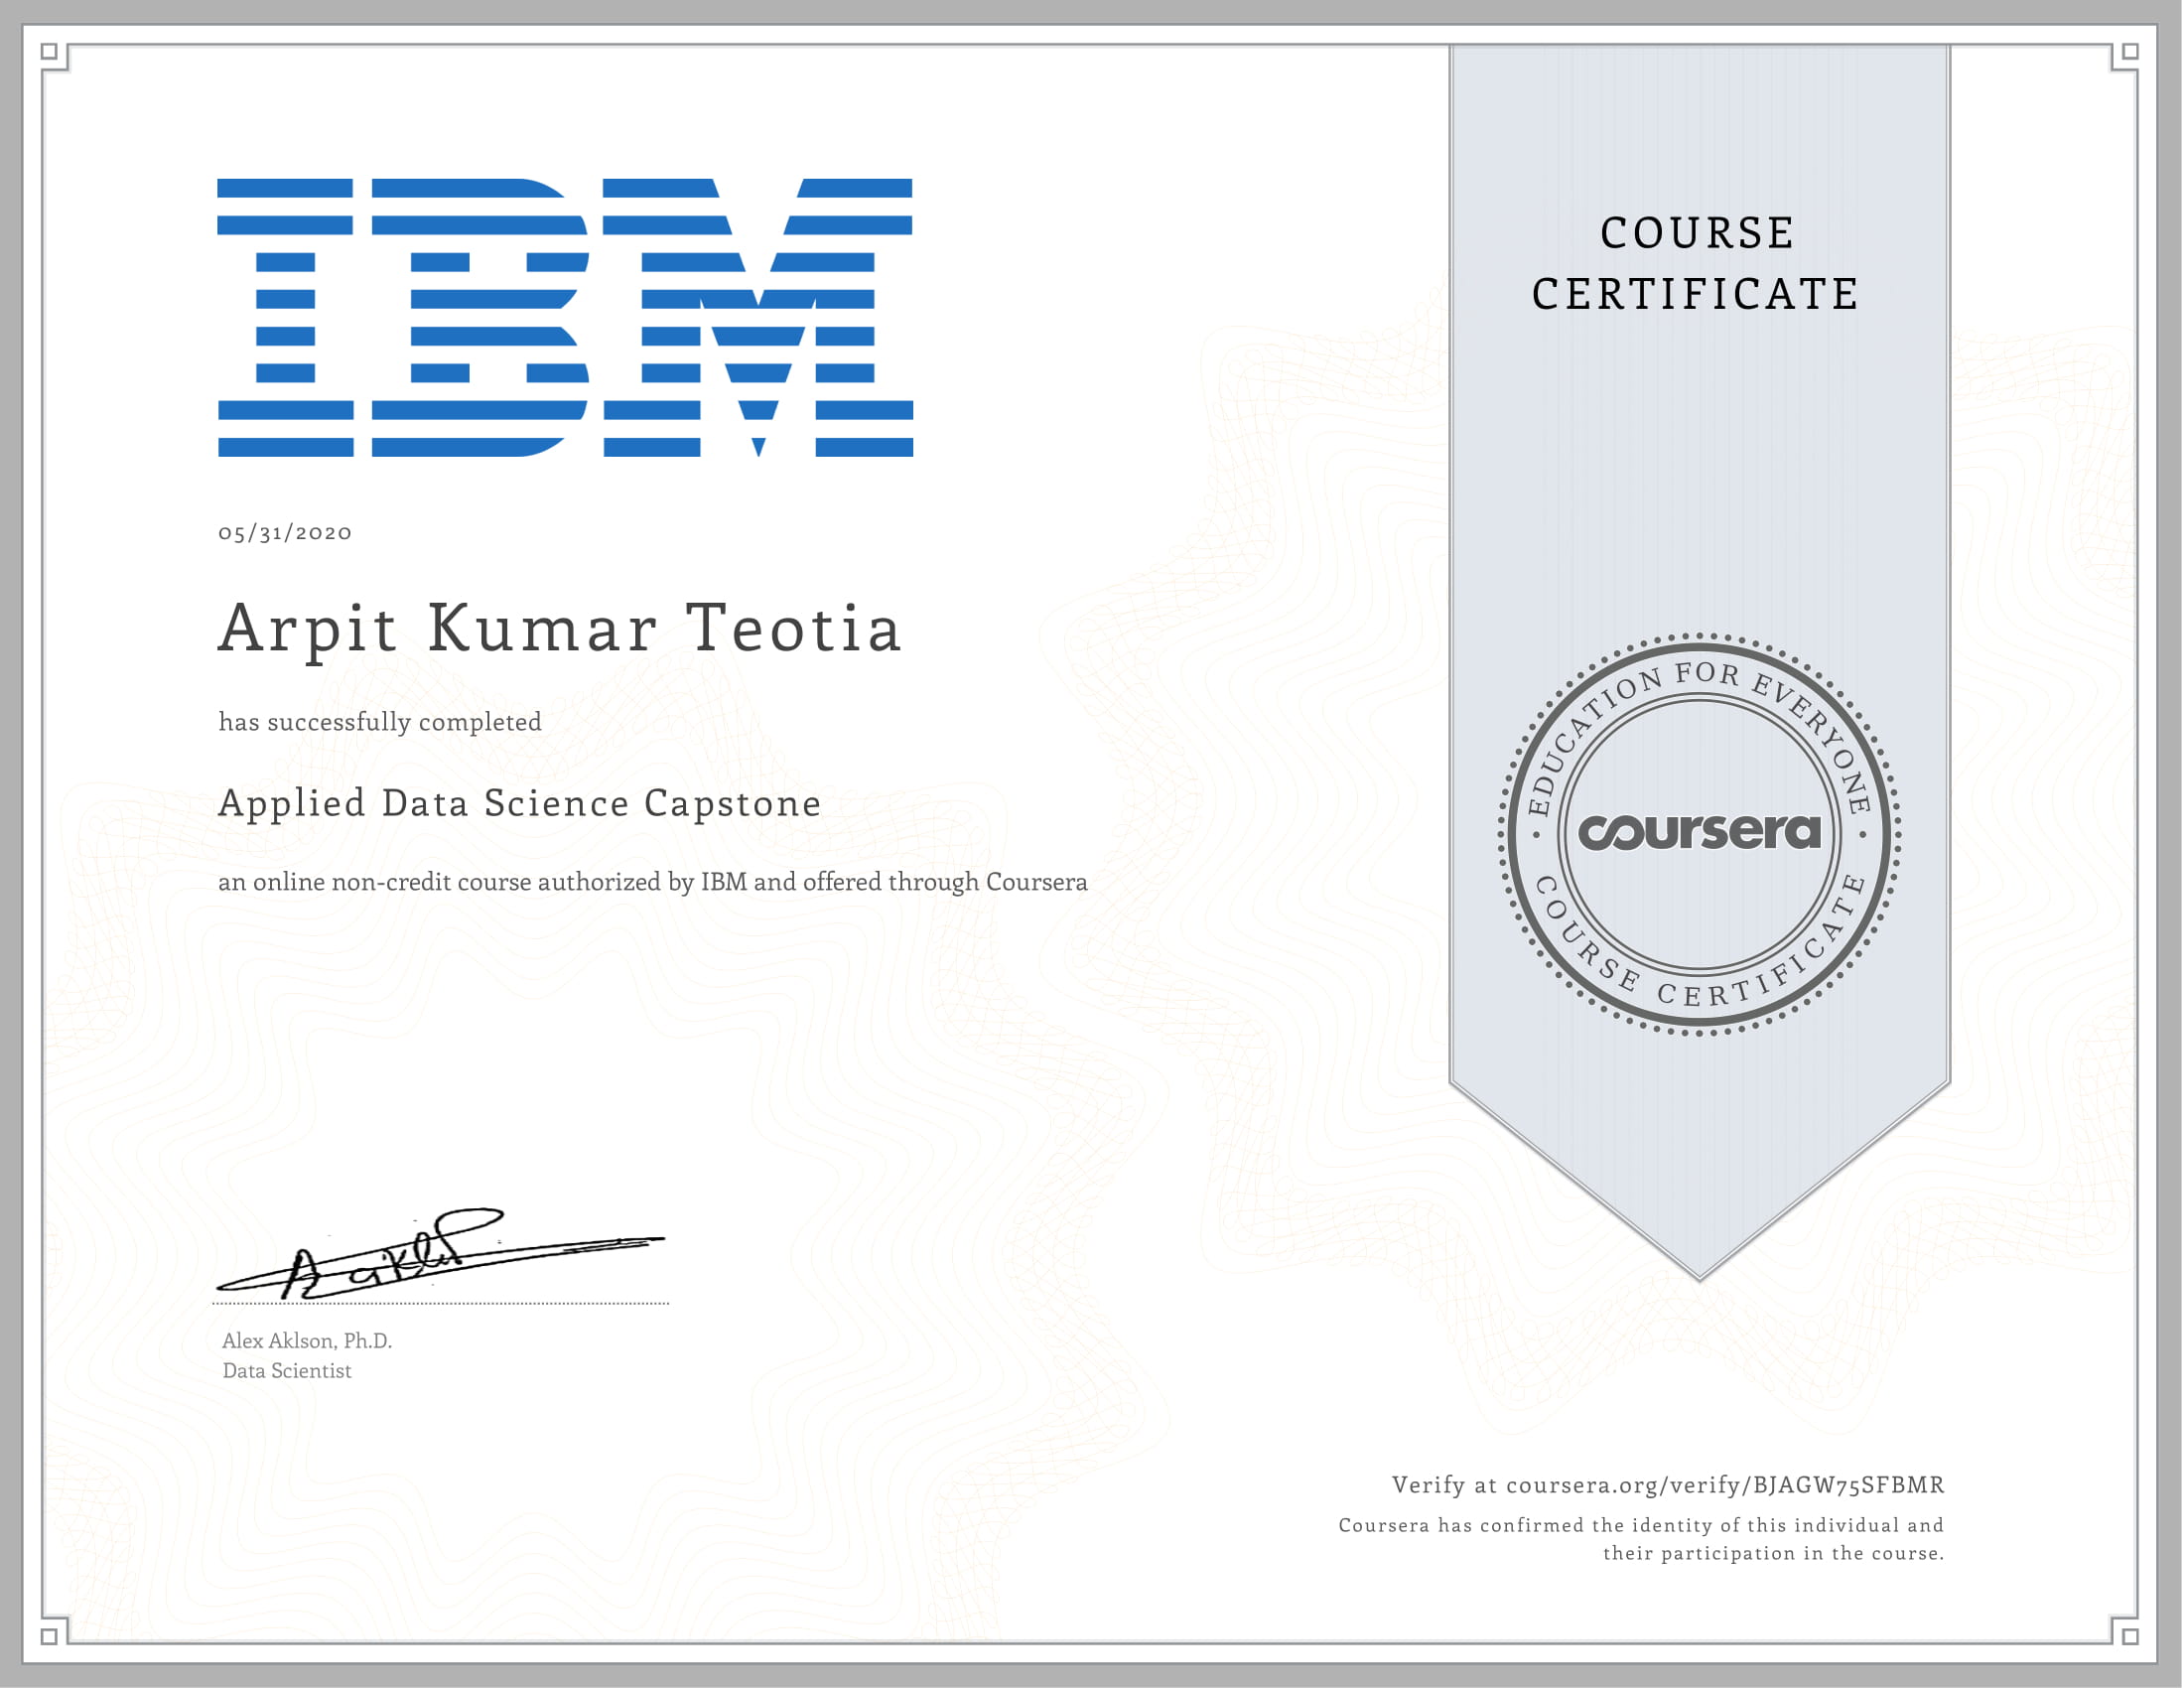
Applied data science project
May,2020
A project on using segmentation and clustering to develop insights from a dataset of toronto depicting how the public transport systems are affected throughout the year. These insights were then used for pictorial representation through various applied data science methodolgies in the form of waffle charts and other geo spatial data visualisation tools.


